
Do you prefer your slicers on the report page or in the filter pane? I preference the filter pane for a multitude of reasons I shan’t be unpacking in this blog. Though you can check out a really great conversation on this topic <here> and <here>.
In building a dummy dashboard (with dummy data) for an upcoming Deneb demonstration, I went with my preference and placed filters in the filter pane and a single date slicer on the page.
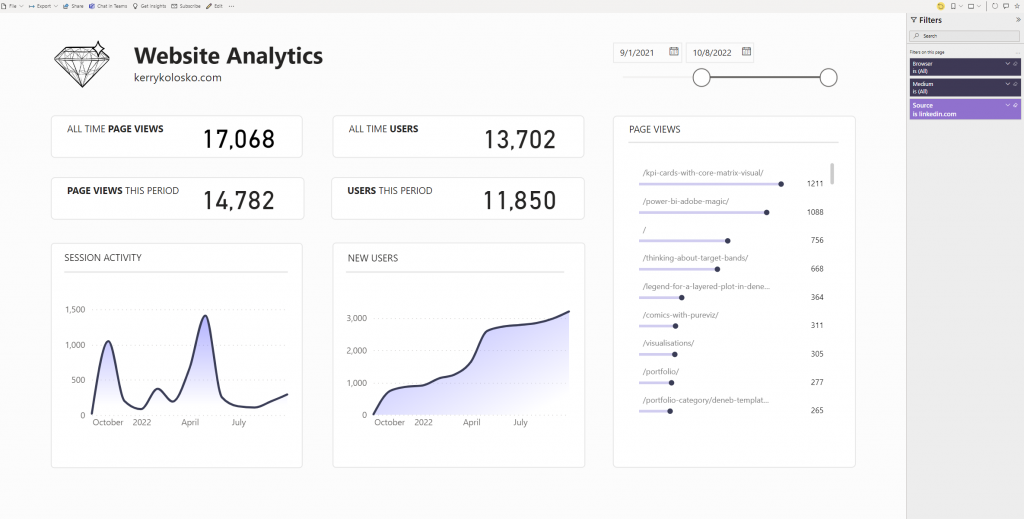
To make the filter pane stand out I increased the font size of the filter pane header, coloured the cards – deeper shade for inactive, brighter colour for applied. I also increased the font size on the applied filter cards.
As the filter pane is not static, and can be expanded and collapsed, I wanted to apply a notice on the page to warn there were filters applied.
There have been tips circulating about how to do this for quite a while, (it’s a technique I’ve applied to reports before), and with a search I found Chris Hamill’s blog which I leveraged as a starting point (why start from scratch if you don’t have to?).
As my Power BI report was designed to be an interactive dashboard, I decided a simple count of filters applied would suffice.
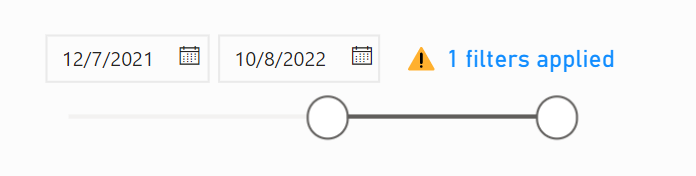
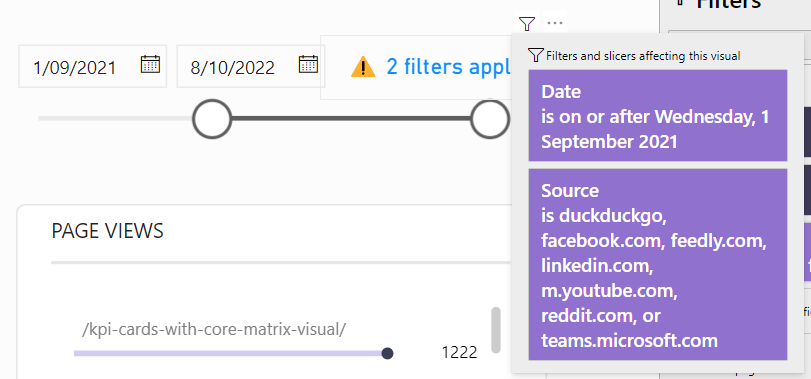
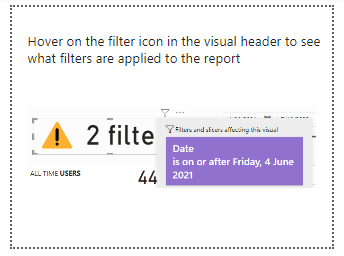
However, I found I instinctively wanted to press on the filters applied warning for more information. Obviously, this would produce no action. But hovering my mouse over the visual, I could see a tooltip. I thought briefly about using a custom tooltip to display the filter selections, but quickly decided against this as it would would require some hefty DAX. What was also there, upon hovering over the visual was the filters icon which appears in the visual header. I often forget this is there. Hovering over the filter button, I can see an expanded list of filters applied:
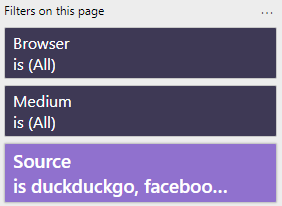
Which is better than hunting through the filters pane to find what filters have been applied. As can be seen in the image below, the filter pane often truncates our selections:
So to help me in remembering this feature exists, I took a quick screen snip, and placed this in a custom tooltip:
And got the following result:
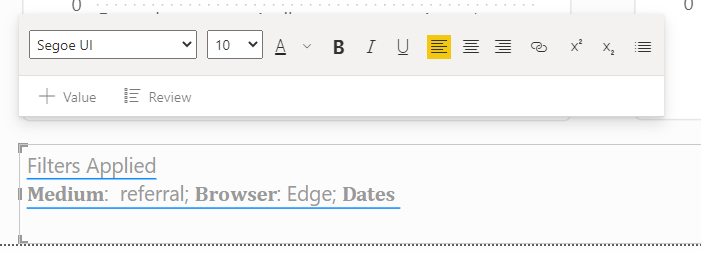
I thought this was pretty neat. Pretty neat for consumption of the report online. However, if I wanted to export or print the page for consumption elsewhere, the filters applied warning might be a little alarming and quite out of place. In which case I would want to see a list of filters being applied, as demonstrated below:
To create bold font, I went to font generator Font Generator 𝒫𝑜𝓅𝓊𝓁𝒶𝓇 𝒮𝓉𝓎𝓁𝒾𝓈𝒽 𝐹𝑜𝓃𝓉 to pick out some unicode text to paste into a measure.
Filters =
VAR source = IF(ISFILTERED('All Web Site Data'[Source]), "𝐒𝐨𝐮𝐫𝐜𝐞: " & SELECTEDVALUE('All Web Site Data'[Source]) & "; ", "")
VAR medium = IF(ISFILTERED('All Web Site Data'[Medium]), "𝐌𝐞𝐝𝐢𝐮𝐦: " & SELECTEDVALUE('All Web Site Data'[Medium]) & "; ", "")
VAR browser = IF(ISFILTERED('All Web Site Data'[Browser]), "𝐁𝐫𝐨𝐰𝐬𝐞𝐫: " & SELECTEDVALUE('All Web Site Data'[Browser]) & "; ", "")
VAR datefilter = IF(ISFILTERED('Dates Table'[Date]), "𝐃𝐚𝐭𝐞𝐬 ", "")
RETURN
source &
medium &
browser &
datefilter
I then created a second measure:
Any Filters =
var anyfilters = IF(ISFILTERED('All Web Site Data'), "Filters Applied", " ")
Return
anyfilters
To add to a smart text box:
This little design feature does impact report performance, and is certainly not ideal for every reporting instance. If you are inclined to test it and find a more optimal solution – let me know how you go and post in the comments below…
Toodles
/\___/\
|= ͡° ᆺ ͡°)=
\╭☞ \╭☞ Happy Vizin’!
Kez