
This mid-year has been an awfully busy time for me. A number of family events, holidays and a company change, have kept me occupied.
Which has meant that it’s taken me a little longer to play with some of the newer Power BI features than I ordinarily would. But, last weekend my curiosity finally got the better of me and I sat down to take a look at field parameters.
Querdle : Power BI Word Game – Available for download here : Wordle for Power BI – Microsoft Power BI Community
I’d seen quite a few inspiring posts by people showing what could be done with field parameters. One with a Gantt chart – I had most definitely needed this in a past life. Another as part of Reid Haven’s challenge which featured an interesting shuffle button. And one by Daniel Marsh-Patrick, who as usual, left me puzzled — I still haven’t worked how he managed to change the graphs entirely. So I was interested to see how field parameters worked and if there were other ways it could be applied.
In getting started I pasted a few letters and numbers into a table to represent categorical and quantitative data and began mucking around.
I dragged a field into matrix visual and saw the letters appear in the top row… laid out kind of like wordle…
Hmmm… like wordle… well that was it. I was off on a tangent. I was going to make a wordle game with field parameters.
I didn’t want to put an awful lot of time into the game, it was more of an exploratory piece than a technical showcase, so my design was very focused on finding the most straightforward, least energy-intensive path. That meant simple measures, minimal bookmarks and minimal visuals layered on top of another.
In thinking about a means of “storing” users’ letter selections, I started out with a single table containing the list of letters and a slicer on the page to get my brain ticking…
… and decided that there would need to be a separate and table & filter for each letter selection.
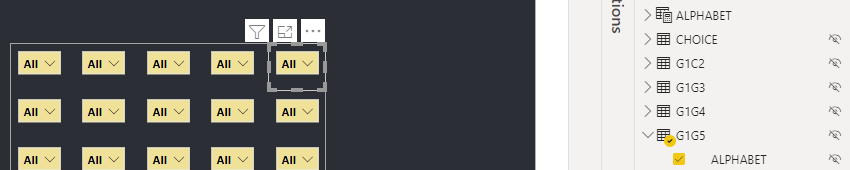
To do that I created some calculated tables and named them according to their position on the game board, resulting in 30 disconnected tables, for a 5 x 6 grid. Each table had an associated measure, returning the selected filter value.
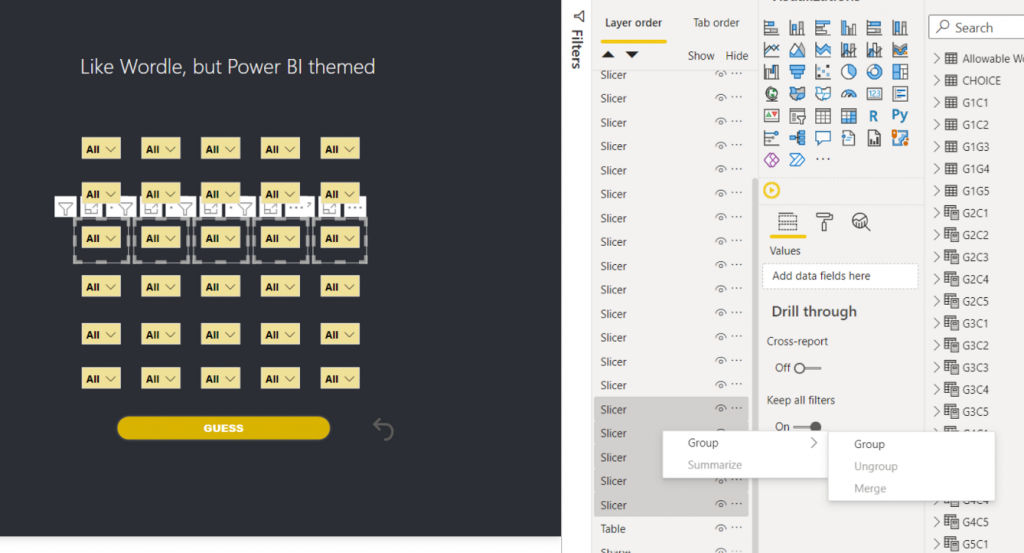
I next created Field Parameters on the measures for each of the game board rows…
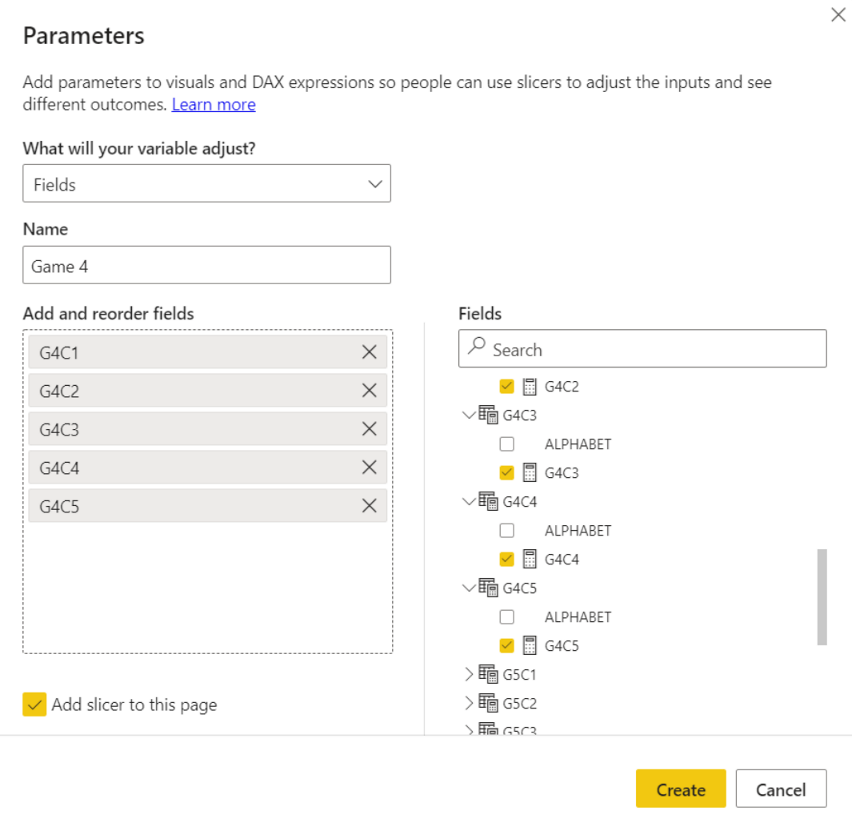
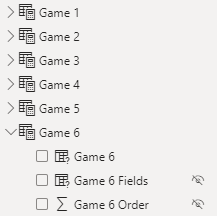
…and then placed them in tables, one for each row.
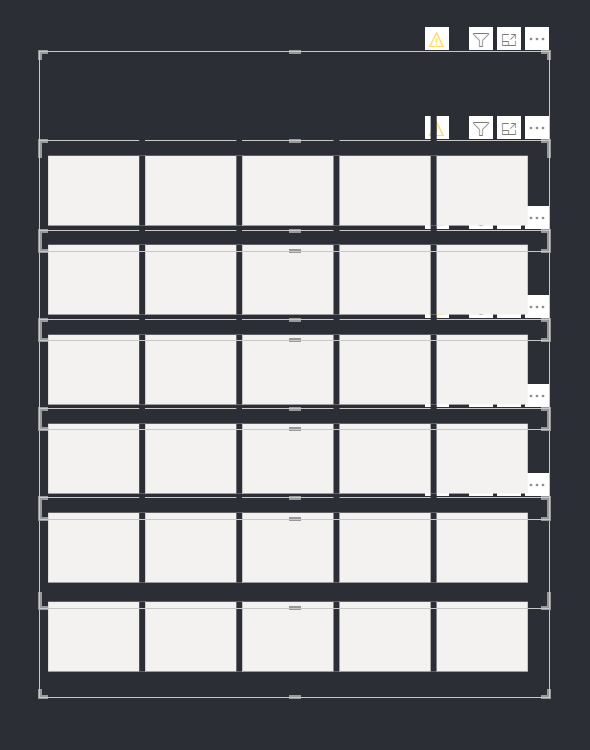
Created filters for each grid square…
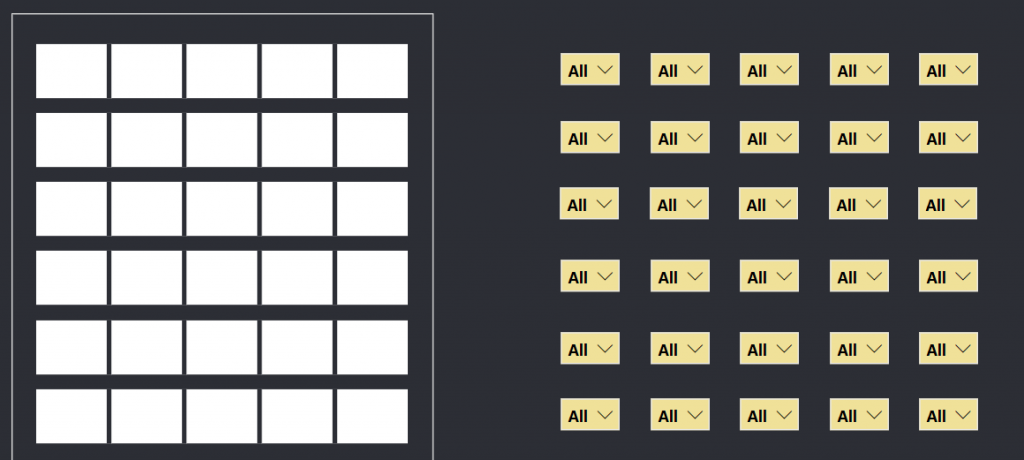
… and placed the corresponding fields into the filter fields well.

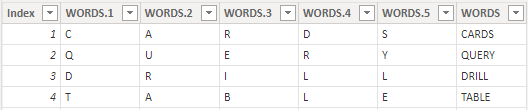
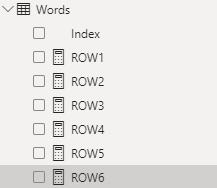
Words List
I created a table of Power BI related words and pondered whether I would create a calculation that would display a new word each day or a new word on refresh. I decided that I would display a new word on refresh, and that this would be random so that myself and my daughter might enjoy the game without knowing what word would be next. It does mean that some words would repeat but with approx 100 words in the list that would not be problematic.
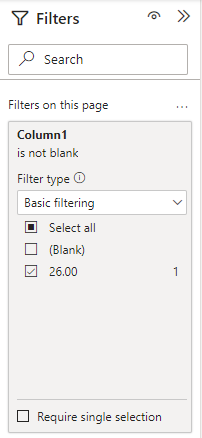
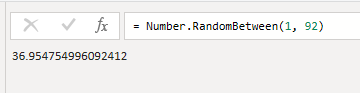
I created a query that generated a random number between the first and last index number then filtered the report page <> blank.

Conditional Formatting
Next up I needed to conditionally colour the backgrounds of the grid according to the following rules:
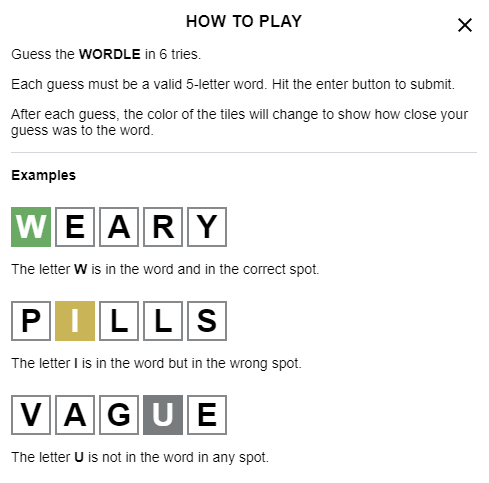
Green background colour for the correct letter in the correct spot, yellow background colour for correct letter in the wrong spot and grey background for incorrect letters.
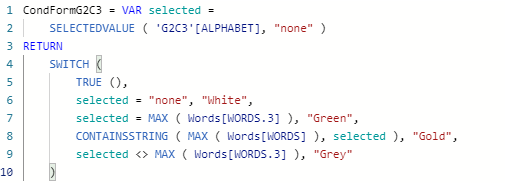
To do this, I decided I needed a measure for each disconnected table…
Rather than manually create 30 measures, I utilised Tabular Editor.
foreach(var c in Selected.Columns)
{
    c.Table.AddMeasure(
    "CondForm" + c.Table.Name, // Name
    "Var selected = SELECTEDVALUE(" + c.DaxObjectFullName + ", \"none\") RETURN SWITCH(TRUE(), selected = \"none\",\"White\", selected = MAX(Words[WORDS.1]),\"Green\", CONTAINSSTRING(MAX(Words[WORDS]),selected),\"Gold\", selected<>MAX(Words[WORDS.1]),\"Grey\")", //DAX expression
    c.DisplayFolder // Display Folder
);}
Which returned the following on each table
Bookmarks
Bookmarks were created to reveal a row of slicers for each guess.
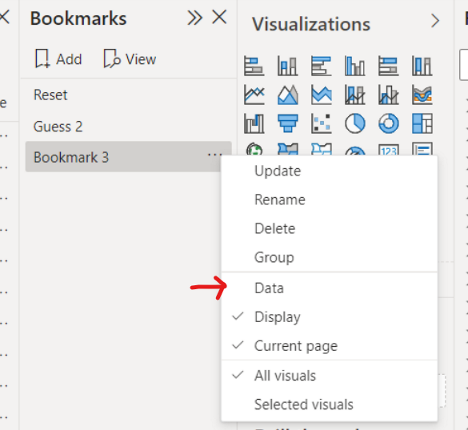
A bookmark was created to reset gameboard, and another to reveal the answer. All slicers were hidden when answer was revealed, disallowing the gamer to continue making further selections, thus ending the game.

A final bookmark was created to allow the gamer to share their results with friends.
Share with Friends
To share results with friends I needed to create a text string that could be copied from a visual. This proved easy with the matrix visual.
I created a * cough cough * simple DAX measure returning coloured circle emojis for the results of each gameboard row #sorrynotsorry

Unified these into a single measure and single table which could be selected, copied and pasted elsewhere…
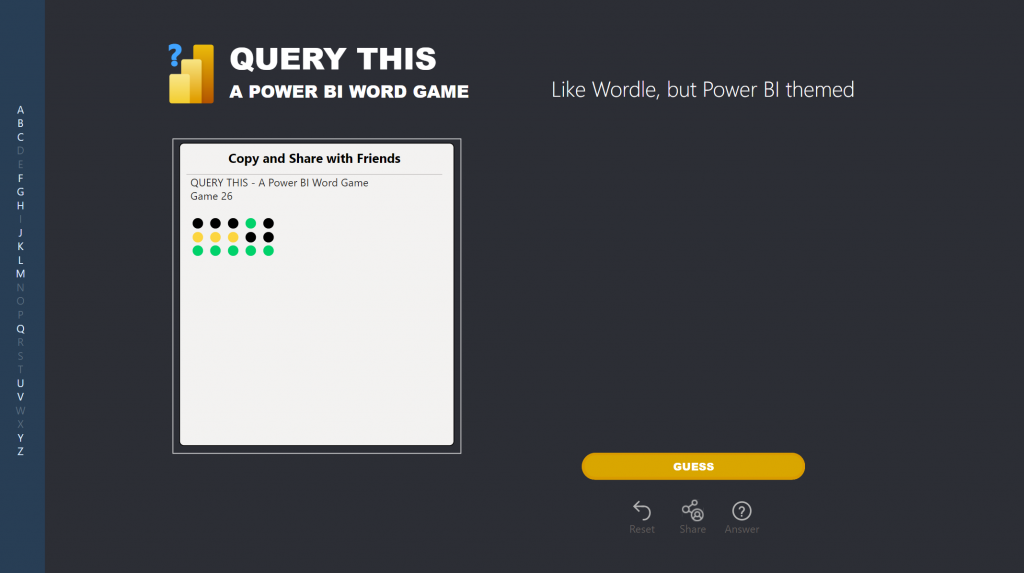
… like so:

Finale
I may have gotten a little carried away creating this game, but had fun whilst doing it. Selfishly, I gained the admiration of my daughter who wants to be a game designer when she grows up 🙂
Her smile was worth it!
Querdle : Power BI Word Game – Available for download here : Wordle for Power BI – Microsoft Power BI Community
/\___/\
|= ͡° ᆺ ͡°)=
\╭☞ \╭☞ Happy Vizzin’ !