
I’d written in a previous post about building a custom gauge table with HTML. This is an extension of that post with DAX for additional gauges or microcharts.
Radial Gauge
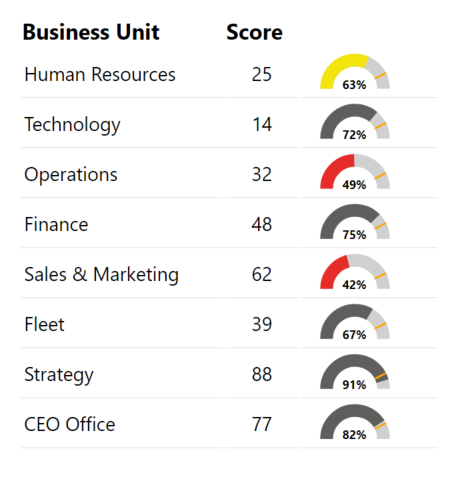
Radial Gauge =
"<div>
---View Box---
<svg style='width: 70px; height: 30px; display: block' viewBox='-2 -2 70 70' overflow='visible'>
---Track: Move to (x,y) Arc (rx,ry x-axis-rotation large-arc-flag sweep-flag x,y) ---
<path id='track' fill='none' stroke='#D0D0D0' d='M10,55 a45,45 0 1 1 90,0' stroke-width='20' />
---Gauge conditional colour fill = Percent of Total * πr---
<path id='fill' fill='none' stroke="&[Conditional Colour]&" d='M10,55 a45,45 0 1 1 90,0' stroke-width='20' stroke-dasharray='141.3717' stroke-dashoffset="&""""&(1-'KPI'[KPI Percentage]) * (PI()*45)&""""&">
---Tooltip---
<title>Percent: "&'KPI'[KPI Percentage]&"</title>
</path>
---Target Marker = Percent of Total * 180 degrees---
<path id='target' fill='none' stroke='orange' d='M0,55 L20,55' stroke-width='3' transform='rotate("&MAX('KPI'[Target])*180&" 55 55)'/>
---Label---
<text x='35' y='55' font-weight='bold' >"&FORMAT('KPI'[KPI Percentage], "0%")&"</text>
</svg>
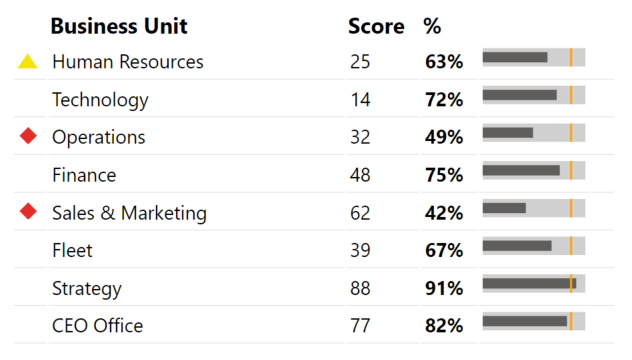
</div>"Linear Gauge or Bullet Chart
---Track---

<rect id='track' x='0' y='0' width='100' height='18' fill='#D0D0D0'/>

---Gauge Fill---

<rect id='fill' x='0' y='4' width="& 'KPI'[KPI Percentage]*100 &" height='10' fill="&[Conditional Colour]&">
   <title>Percent: "&'KPI'[KPI Percentage]&"</title>
</rect>

---Target Marker---

<rect id='marker' x="&Max('KPI'[Target])*100&" y='0' width='2' height='18' fill='none'></rect>
Basic KPI Indicator Shapes
---

Red Diamond =
"<div>
    <svg width='20' height='20' xmlns='http://www.w3.org/2000/svg' xmlns:xlink='http://www.w3.org/1999/xlink' overflow='visible'>
        <rect id='diamond' x='5' y='5' width='12' height='12' fill='#e62c29' transform='rotate(45) translate(5,-10)'/>
    </svg>
</div>"

---

Amber Triangle = "<div>
    <svg width='20' height='20' xmlns='http://www.w3.org/2000/svg' xmlns:xlink='http://www.w3.org/1999/xlink' overflow='visible'>
        <polygon points='10,5 0,20 20,20' style='fill: #F4E40E'/>
    </svg>
</div>"
Pie Charts
--- a = 2(pie) x amount/grandtotal ; x = cos(a) *100; y=sin(a) *100 ---

"<div>
    <svg width='20' height='20' viewBox='-100 -105 205 205' >
        <g transform='rotate(-90)' transform='translate(-172,169) scale(0.8,0.8)'>
            <path d='M100,0 L100,0 A100,100 0 1,1 "&COS((2*PI())*1)*100 & "," & SIN((2*PI())*1)*100&" Z' stroke-width='3' stroke='black' fill='#E6E6E6'></path>
            <path d='M0,0 L100,0 A100,100 0 "&IF([KPI Percentage]>.5,1,0)&",1 "&COS((2*PI())*[KPI Percentage])*100 & "," & SIN((2*PI())*[KPI Percentage])*100&" Z' fill='"&[Conditional Colour]&"'></path>
        </g>
    <svg>
</div>"
Love it!
Tks for sharing.
please share the source file for Radial Gauge and PBX